Reframing reporting around the metrics HR leaders actually use
Client
TELUS HEALTH
Role
Lead UX Researcher
When
2024
Activities
Scoping, Secondary Research, User Interviews, Max-Diff
1) Executive summary
We were able to reprioritise the reporting roadmap and information hierarchy around the few metrics HR Leaders consistently value most, using MaxDiff to reduce opinion-driven debates and align teams on “what matters” (mental health, service use, engagement, and clear adoption-style counts).
My role: Lead UX Researcher (end-to-end: problem framing, method selection, analysis and recommendations).
Team / collaborators: Design partners and cross-functional stakeholders supporting Strategy Portal plus Customer Success Managers (CSMs) as a key user group and recruitment channel.
2) Challenge & context
The problem space
The Data Dashboard Portal is positioned as a self-serve analytics hub for client leaders, but adoption is slow and utilisation is low. Clients report information overload, terminology confusion, and a sense that the Portal is “dumping data on a dashboard without explanation or outcomes.”
A key business driver was retention and renewal risk: internal win/loss signals suggested reporting gaps (including divisional reporting) were contributing to lost deals, but the product team lacked clarity on what to fix first.
Research goals (knowledge gaps)
Understand barriers to adoption for both clients and CSMs.
Identify which metrics and features are most valuable to HR decision-makers.
Clarify what segmentation and integrations matter most to make the data actionable.
Constraints
No analytics instrumentation on the platform, limiting behavioural usage evidence and pushing us toward attitudinal + task-based methods.
Mixed audiences with potential misaligned incentives (e.g., assumptions that some CSMs may be hesitant to push self-serve if it changes their role).
3) Strategic approach & methodology
Why MaxDiff
With competing stakeholder opinions and a long list of possible improvements, we needed a method that would:
Force meaningful tradeoffs.
Produce a defensible prioritisation signal.
Be fast enough to run globally and quantify relative value.
MaxDiff gave us relative preferences across many items in a way simple importance ratings often fail to do (everything becomes “important”).
Method stack
Mixed-methods plan: secondary research and in-depth interviews to uncover barriers and friction without relying on product analytics. We also needed this data layer so that we had some context for the MaxDiff results and not just a giant list of wants.
Quant layer - two MaxDiff studies:
Wellbeing data metrics: 47 respondents, mix of clients and CSMs.
Portal feature priorities: 110 HR leaders across CA, UK, US, IE, AU.
Participant strategy
Targeted the decision-makers most tied to renewal value: HR leaders who use or would use reporting for program decisions. I used my relationships with the CSMs to recruit this sample which naturally meant a lot of manual work to get the numbers I needed but the sample being correct was important so we decided not to use external recruitment panels.
Included CSMs (in the wellbeing metrics study) to reflect real-world workflows where CSMs often interpret reporting on behalf of clients.
4) The “messy middle”
Stakeholder alignment / influence
Started by making assumptions explicit (e.g., perceived CSM resistance, segmentation being a major adoption driver), then translated them into research questions and decision points stakeholders could rally around.
Used MaxDiff results as a prioritisation artifact to shift conversations from “feature lobbying” to “what best supports HR decision-making”.
Navigating ambiguity without analytics
Since we could not validate usage patterns through analytics, we designed tasks and questions that tested “data interpretation” and “finding recommendations” to understand whether value issues were actually discoverability and comprehension problems.
Open-text “feature additions” to capture unmet needs that weren’t in the list (e.g., predictive analytics, ROI measurement, alerts).
Downstream implications for IA, defaults, and segmentation/integrations.
5) Insights & actionable recommendations
HR leaders prioritise employee wellbeing outcomes and programme effectiveness signals over “dashboard completeness.”
Evidence: Mental health ranked #1, with the strongest positive preference signal (high “best,” low “worst”), followed by service use and engagement rate.
Recommendation: Rebuild the Portal’s top-level reporting narrative around:
Mental health (and other high-salience domains)
Service usage patterns
Engagement + utilisation as outcome proxies
Treat other metrics as secondary layers instead of first-class navigation.
People want counts that answer “are employees engaging?” not averages that feel abstract.
Evidence: In the wellbeing metrics study, “Total users who started a program” and “Total users who completed a module” outranked “average per user” measures by a wide margin.
Recommendation: Make adoption-style counts the default headline KPIs. Place averages behind “advanced” views or contextual tooltips for analysts.
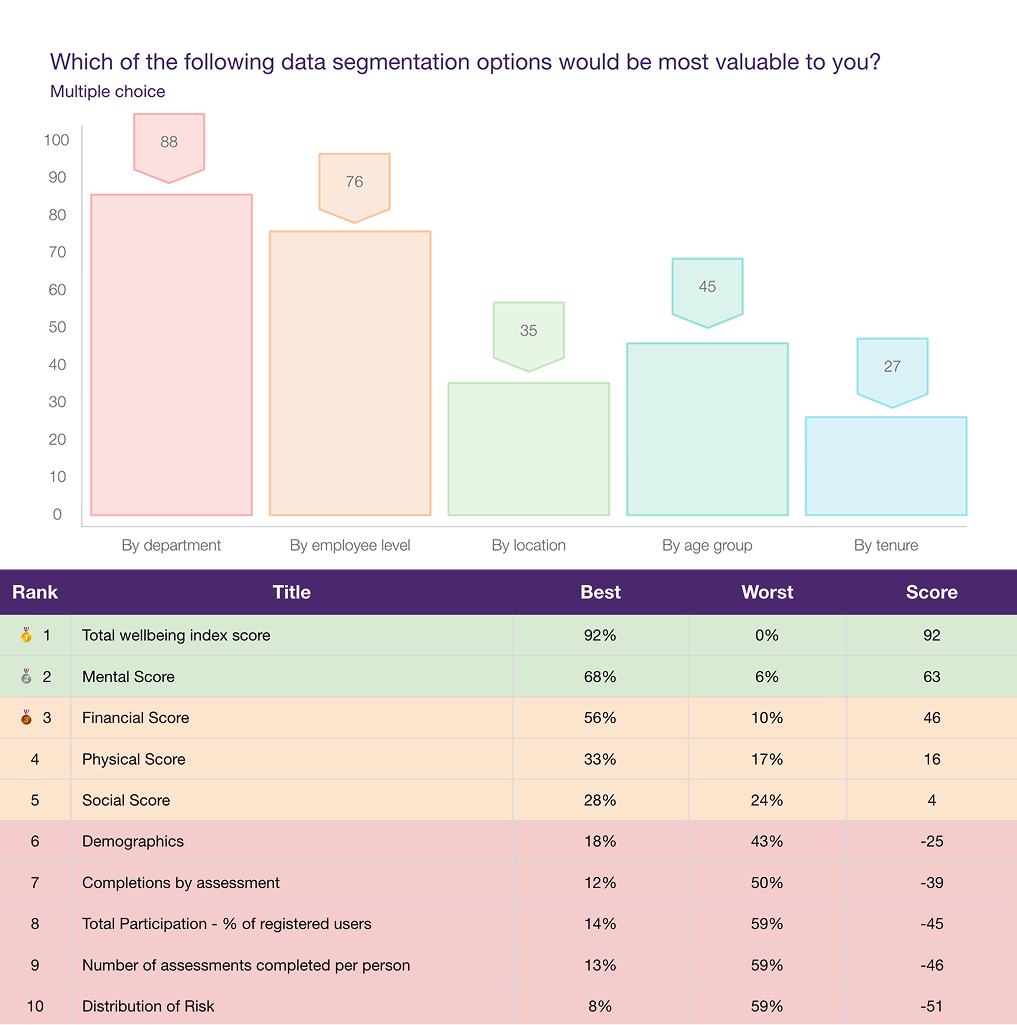
The market signal is “make it actionable,” which implies segmentation + integration, not more charts.
Evidence: Department and employee-level segmentation were most valuable; the top desired integrations were HR systems and performance management tools.
Recommendation: Tie roadmap bets to “decision workflows,” for example:
Segment mental health and service use by department / level.
Enable exports or integrations to join wellbeing signals with HR and performance context.
There is a capability gap: users often use EAP data, but confidence in interpretation is not uniformly high.
Evidence: Confidence clustered around “4 out of 5,” with a notable drop at “5,” suggesting comfort but room for better guidance and interpretation support.
Recommendation: Add interpretation scaffolding:
Plain-language definitions
Benchmarks and “what good looks like”
“Recommended actions” patterns (especially for high-priority domains like mental health)
A snapshot of the data and results from the study
6) Business impact & outcomes
What this research changed
Roadmap focus: Converted a broad, opinion-heavy feature backlog into a ranked set of priorities grounded in HR leader tradeoffs (mental health, service use, engagement, then supporting metrics).
Scope discipline: Provided evidence to deprioritise or demote low-signal items (e.g., company overview and management consultations ranked at the bottom in the feature MaxDiff).
Design direction: Supported a “less but clearer” information hierarchy. This directly responds to the client complaint about “dumping data” without outcomes.
Reflections
This project highlighted what can happen when a product lacks analytics or observable data, teams risk building based on anecdotes. Establishing a quantitative prioritisation layer (MaxDiff) plus qualitative validation (interviews) is a pragmatic maturity step toward evidence-led roadmaps.